Finally I managed to access the original blog-site. After handing over the company to my son, we created a blog, but the main one was about VRBI, so he never used the one for Scientassist. Fortunately he still had the username and password and after many years now the original address is back, instead of this one with the huge number (looking like a phone number in it.
So, cutting it short: from now on the blog will be at http://scientassist.wordpress.com and this address will be discontinued. The posts were copied to the new environment, so there is no need to remember this one (and be honest – who would be able to remember the 674270259?? Not me!).
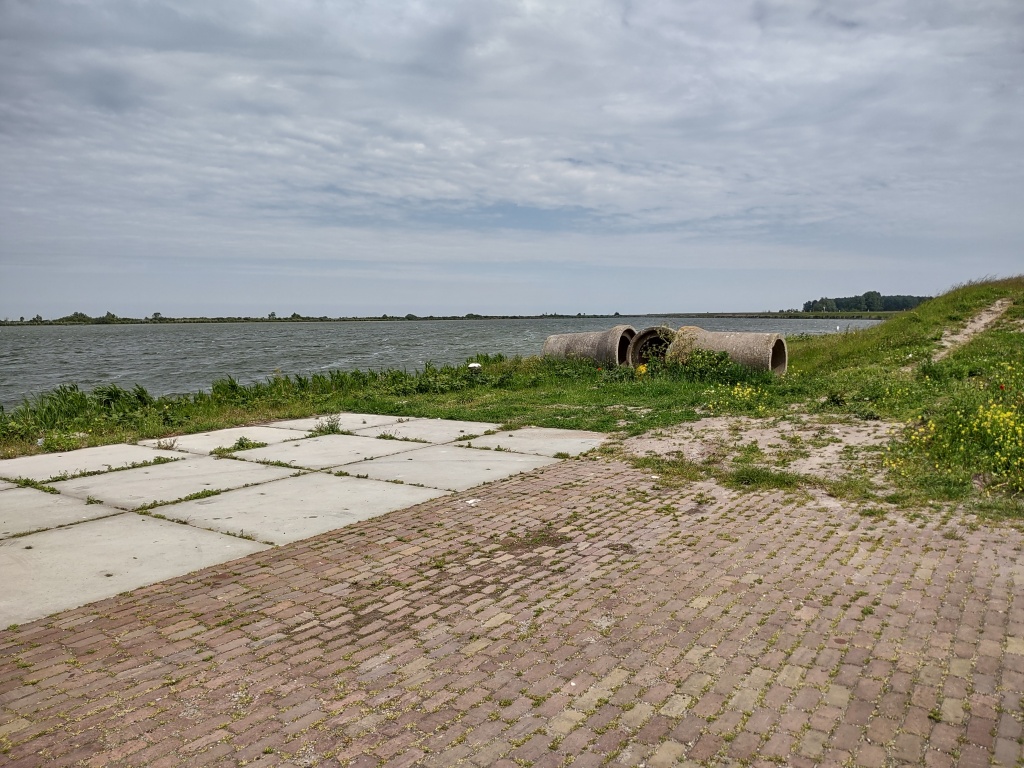
Nearly two weeks ago I took samples along the dyke (Oostvaardersdijk) from Lelystad, via Almere to Zeewolde. The post about this set of samples showed a map with pH values. Somewhere at the beginning of the parking IJmeerdijk the pH value was rather high: 8.7 Previously the same high value also came up, so now I was looking for more detail. This time I planned to look at the other side of the bridge as well. We live in the “new land” (polder), but after crossing the bridge the “old land” is reached. Would things be different there?
To be honest, I didn’t think it would be possible to defeat the high pH score of the Hoornse Plas in the province of Groningen (9.57), but this time things were even more extreme. Again it was in an area where people are chilling out at the beach (a very small beach), SUP-ing (Stand-Up Paddle-boarding – I didn’t know it was an abbreviation), rowing or swimming.
The cause of the high pH is probably not at the Almere side after all, because there the pH values over there were much lower. Here the top-score was 9.70 – soapy water again! I still don’t know if this is caused by human presence.
Yet it was a bit strange that about 750 metres away from the small beach the pH was still 9.63! Because the sampling was done at this point first, I wondered whether it could be the shells at the beach. After mixing a sample of those with some demineralised water, the pH I got was only 8.08. Surely not an explanation.
The good news is that – despite the high pH – a lot of little fish were swimming in all the Muiderberg-locations. At least this would mean the water was not toxic. Most likely the ammonia-concentration was low. Of course the pH will go up when the weather is hot, but now it was only around 25oC
Getting samples was not easy this time and I had to walk at some of the locations, looking for a good spot (not at a beach or harbour itself, but closer to open water). Again the pH-values are plotted on a map.
Again all values are the average of three samples (third one kept) and again I measured the values of the third sample again when back at home – also checking the reference buffers before and after. Standard deviations (of the samples) were 0.015 or less. The reference values were never more than 0.03 off, so the measurements are reliable. Of course the values remeasured at home were about 0.05 – 0.2 lower, as explained in a previous post.
By now it is time to move on and investigate soil as well. Conductivity will also be added in the future and hopefully some other analytical values.
A couple of posts ago I told you about my trip to the North and the three samples I took. It was only three samples because traffic was much slower than expected and I also had to make a detour. Because of this – although I left two hours early – I could not take the other three samples. It wasn’t a big issue, because nearly all samples until then showed a pH between 7.98 and 8.92. The first samples were at a small recreational lake in the suburbs of the city of Groningen, called “Kardingerplas”. The pH values for samples 1 to 3 were 8.28, 8.32, 8.31, so no surprise with an average of 8.30 and a standard deviation of 0.02. Quite normal. What surprise could the other lakes bring? Well, BIGsurprises!
The next set of samples already brought completely unexpected results. To start with, the lake I selected is a bit complex. It has a section called “Hoornseplas” which is meant for swimming. The other part has to names: “Hoornsemeer” (Norhtern part) and Paterswoldsemeer” (Southern part). In the past (until about forty years ago) two lakes were in place, but taking away the barrier between them, just one lake remained still having two names. There is even another lake to the south (Friescheveenplas), but I didn’t know about it until I was finding out what I had been looking at, later when back at home. To provide an overview of the situation, my sampling points are plotted at the map below.
Coming at the “Hoornseplas” I observed a dam and I wondered whether this was not just a (legally) specified section of the “Hoornsemeer” as it looked like this small lake was completely separated from the larger one. To be sure, I sampled both sides of the dam and the pH was so different that there was no doubt: the two parts are not connected! The part called “Hoornseplas” showed pH values 9.56, 9.56 and 9.58 for the three samples taken, with an average of 9.57 and a standard deviation of 0.01. A pH of over 9.5 (!) is soapy water and perhaps that just what it is. If a lot of people are swimming there, bringing their sunscreens, lotions and shampoos, it might become more of a bath tub than a lake. It’s not dangerous to swim in (then a bathtub full of soap water would be as well), but surely plants and animals won’t love it.
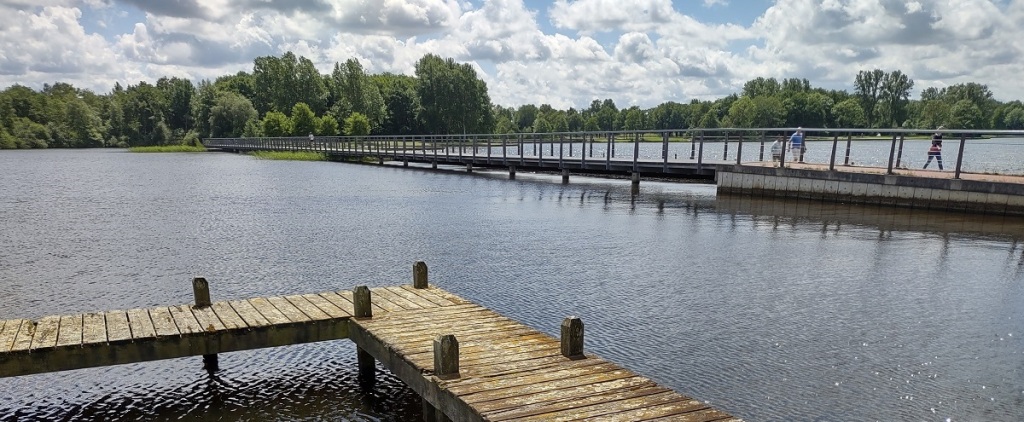
Close to the other side of dam, there was a bridge and there the pH turned out to be only 8.17 (8.16, 8.15 and 8.18). To be sure I took a reference sample at a jetty about 10 metres away and it was 8.15, so we can be sure that the dam is a real dam, separating the two parts allowing them to differ 1.4 points in pH. Probably the dam is in place to save the real lake(s) from the devastating influence of the people bathing there. If so, it was a wise decision. The picture below shows the situation clearly – but there’s another surprise to come!
It’s not the end of the surprises. Sampling at another location, in the part called “Paterswoldsemeer”, I got very inconsistent results between my first and second sample. Standing on a jetty I took the first sample to the left and the second to the right. The jetty is hovering over the water and no barrier at all so I didn’t expect a pH of 8.55 to the left side and a pH of 7.95 to the right and thought this would be a mistake of some kind. Instead of taking a third sample only, I took another pair to the left and to the right and the results showed the same gap. Then I noticed the right side was close to a canal. The water coming from there could influence the water to the right of the jetty, leaving the water to the left more or less unchanged. There was a small bridge over the canal and I took a sample from there and indeed the pH there was only 7.70! At the end of the jetty, where the two flows would be mixed a bit more, the pH was 8.11. To the far left, far from the influence of the canal, the pH was 8.66. It is a very difficult story, but shown on a map it will be very clear what is going on there.
Paterswoldsemeer
Originally I added an animated gif, to show the situation. Unfortunately then twitter wouldn’t show the link to this post. The animated gif had to be replaced by some pictures.
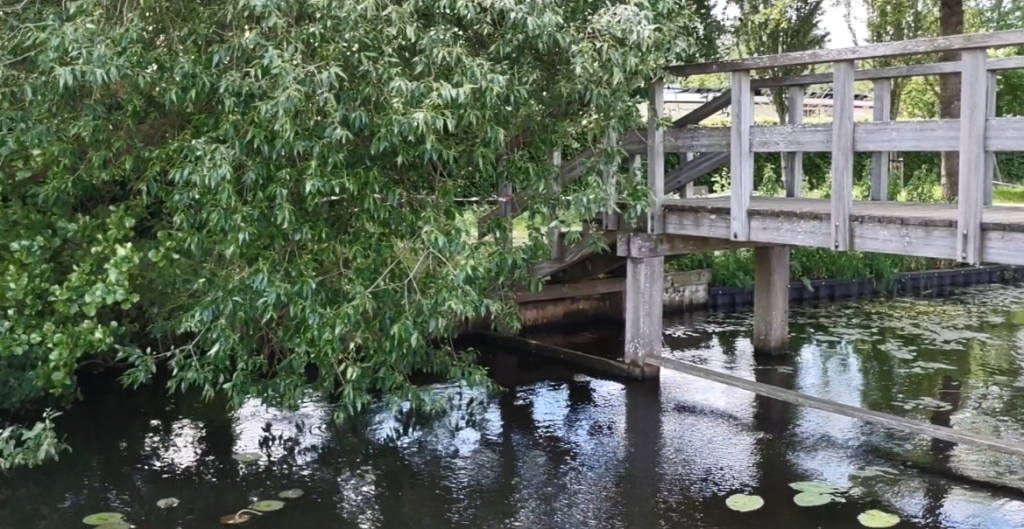
The jetty from where the sampling was done – to the left, to the right and later also at the end.View to the leftView to the right (end of the canal)Looking back at the right side, seeing the bridge over the canal.
You will remember that every third sample from the “two lakes and the river” was kept. The samples were stored in the dark, but at room temperature. Earlier samples from the Weerwater and several other lakes were kept as well. Later the same was done while “sampling along the dyke”, also keeping every third sample.
For all samples, the pH dropped gradually during the days after and even during the hours after sampling, although the difference is quite small for only a couple of hours (usually only 0.01 or 0.02). Yet it was a reason to measure immediately, at the source location.
The decrease of the pH has to be related to biological activity, e.g. bacteria or algae (although we don’t know for sure). Adding cyanide could stop the process, but would change the pH at the same time. I don’t have cyanide and I don’t want to have it either, so that’s not an option. Heating would stop biological processes, but could also influence the pH and the same goes for cooling, although that could be a valid option. We’ll investigate it in the future.
For now it’s enough to observe this drop again and again. However, the change is not the same for every sample!
The (third) samples were measured two times (for the later sets in two cycles, but the standard deviation is always small: 0.01 – 0.02 and the drop is mostly ten times higher) with a check of the buffer’s pH before and after (usually no need for calibration). The results are presented in the graphs below, with some space for the days without a measurement.
Be aware that the scale of the Y-axis is slightly different from previous graphs.
Several lakes
The “Weerwater” is repeated for comparison (see previous post on this subject). This time the graph got the same Y-scale as the others, empty positions were added for days without measurement to make the time-scale more realistic and the demineralised water reference was removed.
The rate of change is not predictable. For one sample it can be 0.2 and for another one 0.6 or even more! Sometimes the pH seems to go up again, but I think that’s because of homogeneity or the sample. I later experiments the sample was stirred while measuring and then the results are more stable.
What really strikes me is that when I was obtaining the Weerwater samples and the days after, the temperature was really high: about 27oC The other samples were taken in a period with a temperature of about 10oC lower, around 17oC. Yet the change of the pH doesn’t seem to be very different. I wanted to show the pH-change against the original pH in a graph. Some approaches were too complex, but with a trick it worked out: a lot of values were available for day 5 and the ones missing had day 4 and day 6 values. I interpolated the latter (taking the average) and used them as day 5 values to get a complete graph. The result is clear: the more the initial pH differs from neutrality, the faster it is moving towards neutrality (although hardly even going beyond 8 within this period).
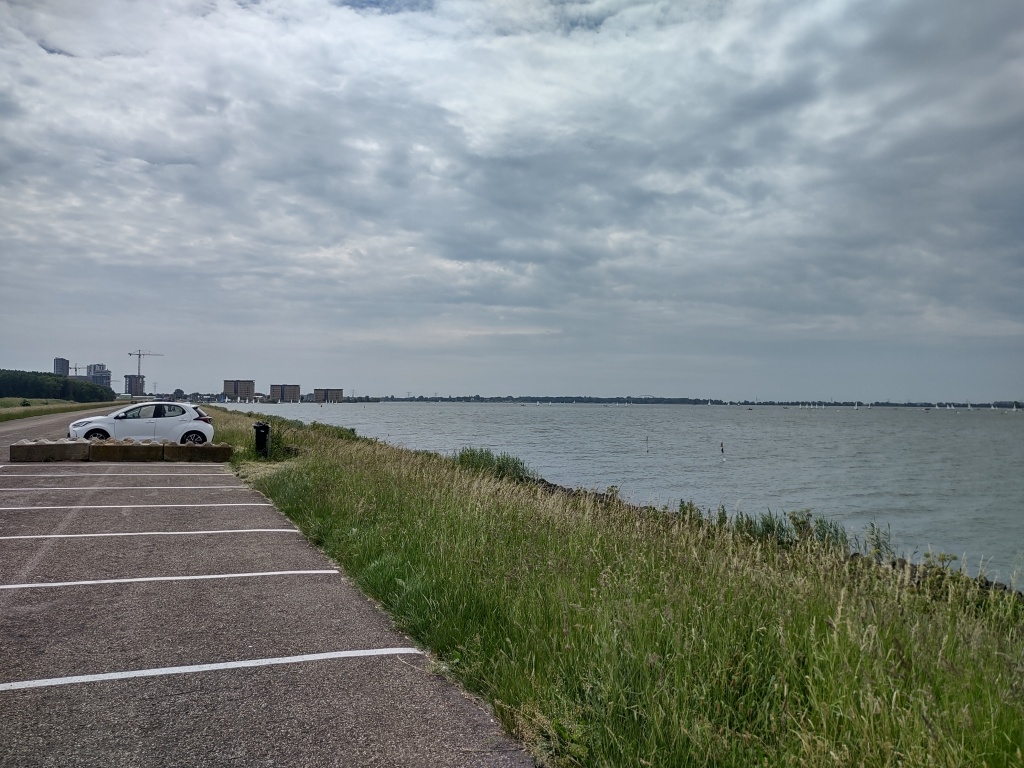
Previously the pH of the Markermeer turned out to be really high. Even when putting the pH-values of all primary samples together, those values were really high in comparison with the other lakes and the river IJssel. Of course I could take some additional samples at the same location, but why not sample along the whole dyke (in Almere)? Starting in the Northern part where the municipality of Lelystad begins and then sampling every couple of kilometres (if possible) until we hit Zeewolde.
Parking Kernplaats
This time I went by car, because it would be a trip of over 50 km (it turned out to be 75), and the wind was really strong. Apart from this now I know that taking and measuring three samples, marking the bottles and taking a picture of the environment takes about a quarter of an hour, so ten samples would add two and a half hours to the journey. The disadvantage is that a car can only be parked at specific parking spots, but the day before sampling I checked all the nice locations on Google maps and sent myself a list of addresses.
The parking places are often at viewpoints, having their own names (in Dutch) like “ Nonnetje”, “Kuifeend” (both names of birds) or more prosaic names like “Pampushaven” (just meaning Harbour of Pampus). Below I show a map of all the locations where I actually took my three samples, with locations in degrees.
Again, I discarded sample 0 as it was only for rinsing the bottle, then I measured samples one to three and kept the third. Values were written down in a notebook, together with the time. A picture of the location was taken for reference and the bottles were marked.
When I came home, a second measurement was done, but only to exclude potential errors (third sample only of course). All values turned out to be very close to the original one for sample 3 – mostly about 0.04 points lower as expected (based on previous investigations, showing a gradual pH drop over time). The high values were moving a bit more towards a lower pH. Of course the earliest samples were older (about four hours) than the later ones (less than an hour), but the pH-shift was not really different. Before measuring again, the pH meter was checked (not calibrated) with two buffer values (6.86 and 9.18). The deviation was still only a couple of hundreds and afterwards (measuring in two rounds) the values were still very close, so no doubt about the accuracy of the pH meter. I present the pH values with two decimals, but keep in mind that the precision is not: the standard deviation will take care of it.
However, one was an exception, because the pH went up, but this was a special sample, taken closely to the Blocq van Cuffeler, the huge pumping station. The three samples had the lowest values measured in the whole series, but were very different from each other, suggesting the water was not very homogeneous. That’s not a surprise, being close to a pumping station bringing (rain-) water from the canals into the lake. Then the third sample was also the one with the lowest original value of those three samples.
Here we will stick to the average of the three values obtained directly after sampling.
The averages and standard deviations (of the population) were calculated and the averages were put on the map. For those who care about significance the averages and standard deviations (for significance testing keep in mind that dividing by the square root 3 provides the standard error of the mean) will be available in a table below. Here we present the pH values in the map, because it offers the best visualisation.
There is no doubt that the pH gets up when we get closer to parking IJmeerdijk near Almere Poort (a very nice parking by the way, where a lot of people are chilling out). Despite this local high, it’s very clear now that the pH will never be below 8.00 in this area (and probably this applies to all Dutch lakes and rivers, let’s see). For the IJmeerdijk value of 8.70 (again!), the question is whether some kind of dump is lowering the pH locally. It could also be the opposite, this being the spot where hardly any fresh water comes in. We could see the effect of fresh water close to the pumping (pH relatively low) station and around it’s outlet to the lake.
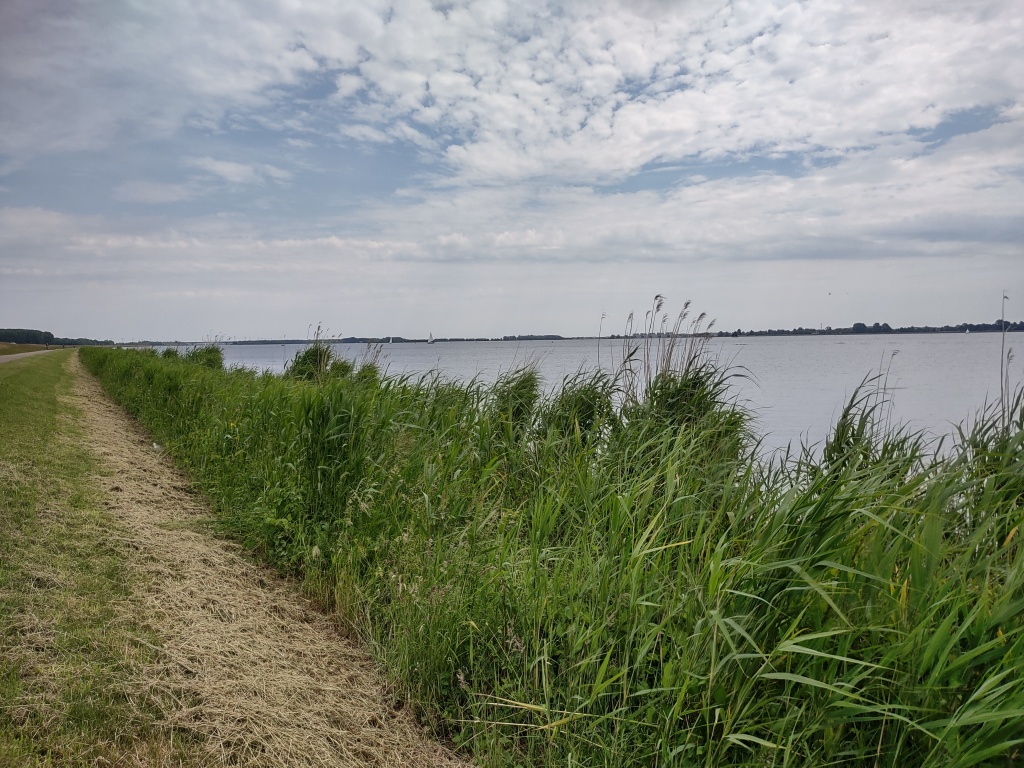
Below pictures of the environment of the sampling points are presented. Be aware that the actual sampling point may be a hundred metres arpart. The real sampling point is just a bunch of basalt rocks, like the picture at “Kuifeend”. I get as close to the water as possible (sometimes really dangerous because of slippery algae and unstable rocks) and I use a stick with a cord to be able to sample as far from the rocks as possible. Then I will avoid beaches, harbours and closed areas as much as possible, staying close to the open water. The sampling point “near da Vincipad is an exception and so is the small bay close to the pumping staion “Blocq van Cuffeler”. At the map it is al very clear, especially when using the coordinates.
This may seem a peculiar statement, because the samples expressed very different pH values. And yet… let’s imagine all the water is just not completely homogeneous, with the differences being just very local. Taking three samples in a row we already noticed the differences. The pH meter also has a random error of probably 0.03 (between different measurements – in a calibration buffer the values are quite stable) and all this together could lead to (small) fluctuations of the observed values.
To test this idea (it’s not a real hypothesis, but more of a thought experiment), we could take all measurements on fresh samples (ignoring the secondary values for the days after) and put them all together. It doesn’t matter whether it was for different samples (triplo) or repeated measurements of the same sample (duplo) and it’s even not relevant which time of the day we took the samples.
In total we got 72 primary values and we won’t use the correction for the drift of the meter (observed during the first measurements) right now.
We can calculated a 99% Confidence Interval (99% CI) for the population (all samples to be taken, using a Z-value of 2,576, so minus and plus 2,576 times the standard deviation of the sampled values, to obtain the lower and upper boundary of the 99% CI). We can expect 99% of our future samples to be within this bandwidth (but beware, this will only apply if the distribution is Gaussian).
Dividing the previous standard deviation by the square root of the number of samples minus 1 (that would be sqrt(71) = 8.43), we can calculate a Confidence interval for the mean.
If we would calculate the mean (taking the average in Excel) for a reasonable set of future samples, we would get a value between those boundaries – at least with a certainty of 99%, so once in a while it could be outside, but that should be very rare.
Determining the median: sorting all values, we can take the value between #36 and #37, but both are 8.16 so that’s easy. Obviously the median is lower than the mean, so the distribution is skewed, we have outliers or both. The mean is very sensitive to outliers, but the median is not. The sorted values can also be visualised in a graph.
72 samples ordered by pH
Then we can see clearly the outliers to the right. Those are the values we corrected, because the values measured for the calibration buffers were too high. Another way to visualise the distribution is the creation of classes.
Now we can see that the shape is not a nice Gaussian bell-curve at all. Even not when the outliers are taken out. But… the bias could be caused by my selection of course. The Weerwater has many more values than e.g. the Markermeer!
What we should do is sample those high pH lakes (especially Markermeer and IJmeer) again and see whether they are really more alkaline* than expected.
To be honest, taking them out won’t change a lot and by now it seems that the pH is nearly always 8 or more. On the other hand, as already mentioned, there is a strong connection with the Ijssel, and because the Ijssel branches from the Rhine, we should consider the South or the East of the Netherlands as well. Let’s see where we get.
* Alkaline (and alkalinity) is now often defined as “resistance of the pH to acid”, effectively being buffering power. However, a long time ago when I was doing the research for my Master’s Degree in biochemistry, we used the word as the opposite of acidity. The word “basicity” to indicate a high pH was not used at all.
The last couple of weeks were all about water samples, but the plan is to sample soil as well. That’s why I bought a nice instrument, allowing me to access several depths, without digging. It’s a kind of hollow drill, called a “soil sample probe”.
Actually I still have to practice, but something else was also important. Soil is not a solution, so how do we measure the pH? Adding water is an option indeed, but does it affect the amount of acid or base? I read a lot about the different options. Some take fresh samples and mix them with water. Others wait until the soil is air dry. The amount of water differs as well between the labs. Some take an equal mass of water to mix with the soil sample, which seems quite reasonable. Others use five or ten times the volume.
Then I encountered several articles talking about Calcium Chloride (I don’t mention the formula yet, because that’s the issue for this post). Adding it would change the pH, but provide more reliable values. The article used says: “Soil pH measured in water is the pH closest to the pH of soil solution in the field (this is true for soils with low electrical conductivity and for soils that are not fertilized), but is dependent on the degree of dilution (the soil to solution ratio). Measuring soil pH in a matrix of 0.01 M CaCl 2 ,as opposed to water, has certain advantages, but the addition of the salt does lower the pH by about 0.5 pH units compared to soil pH in water (Schofield and Taylor 1955; Courchesne et al. 1995).“.
This means I should give it a try, so I decided to get some. Of course it is possible to purchase expensive, high quality chemicals, but here we are talking about mixing it with soil. Calcium Chloride is well known as a de-humidifier and that’s the cheap way to lay hands on it. The advice was to make a stock solution of 1 M and dilute it to 0,01 M (10 mM) and so I did.
The substance is hygroscopic, so I wanted to dry it well before weighing the right amount – 111 grams per mole according to my own calculation – confirmed by a couple of websites to be sure. After 20 minutes in the oven at 75 degrees Celcius or so, created my stock solution (111 grams of CaCl2 filled with demineralised water to 1 liter in total, to get 1M – or at least that’s what I thought) and took 10 ml of it, diluting it to 1 liter to get the 0.01 M.
The article (it’s actually more like a manual) mentioned the conductivity bandwidth (between 2.24 and 2:40 mS cm-1). It seemed a bit superfluous, but I gave it a try. Physics is fun as well, isn’t it? The setting was rather primitive, but sufficient for the purpose. I took about half a meter of and electric PVC pipe and put a plug at one side, pierced with metal screw. The other side I put on a clamp and connected my Ohm meter. First I used a digital one, but I still get confused and measured again using my old analogue one. After some calculations (the diameter of the pipe was 13.5 mm, so the resistance had to be multiplied by 1.43 and divided by 0.45 (length of the tube). Then the resistance was converted to conductivity, by taking the reciprocal. It was about 25% too low (1.7 mS cm-1)!
After some thinking and reading I realised that my pearls – whether heated in the oven or not – were more like CaCl2.2H2O. Otherwise it would have been a powder rather than pearls.
Adding 2 times a water molecule makes a mole: 111+36 = 147 gram. This meant my stock solution was actually 0.755 M and the diluted 0.01 M was actually only 7.55 mM – lacking 25% of the salt. The latter was corrected easily by adding some additional stock solution, but the next time I should take 13.25 ml of stock solution and fill it to 1 litre, to get the 10 mM after all.
I will also investigate if tap-water will do, because in the end it’s cheaper and saves a lot of shopping (I already used ten litres of demineralised water).
Next time we will get back to water samples again.
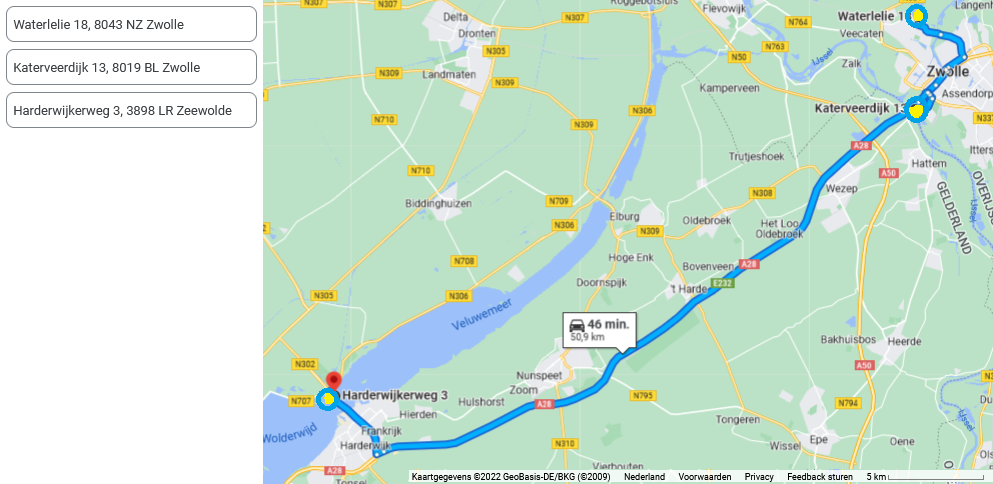
By now nearly all the samples showed a pH of 8 or higher. Yet I went on measuring water samples. Going to Zwolle, I planned three more sample locations. Two were still more or less connected: the Velumemeer and the Ijssel. The latter is a river, feeding the Ijsselmeer, but indirectly also the Markermeer, IJmeer, Gooimeer and Veluwemeer, so it could be that in the end we are more or less looking at the pH of the Ijssel’s water.
The third location however, was less connected, because it was a lake in Zwolle’s neighbourhood “Stadhagen”. The lake’s name is “Milligenplas”.
The three sample points are marked in the Google Maps screenshot of a part of the journey
Like the full day sampling I took three samples at slightly different spots (a meter or several metres apart). After rinsing with the sampled water, the first two samples were discarded, but the third was kept for later investigations. As a result the direct measurement was in triplo.
The results won’t be sursprising by now, although the rather high pH of the IJssel is still remarkable!
The bandwidth of the graph is rather narrow this time: 7.9 – 8.5
Next time we will have a look at all primary values we obtained until now.
One of the possibilities explaining the high pH would be photosynthetic activity, removing the CO2 from the water. The samples are taking close to the surface, but the Weerwater is not a deep lake. At the same time the wind will stir the water and additional CO2 will be solved, so it’s hard to tell which effect is stronger. The only thing we know is that photosynthesis needs light and therefore it makes sense to measure the pH in different light conditions. To investigate the effect I decided to take samples every couple of hours, at just one point of the Weerwater, close to where I live.
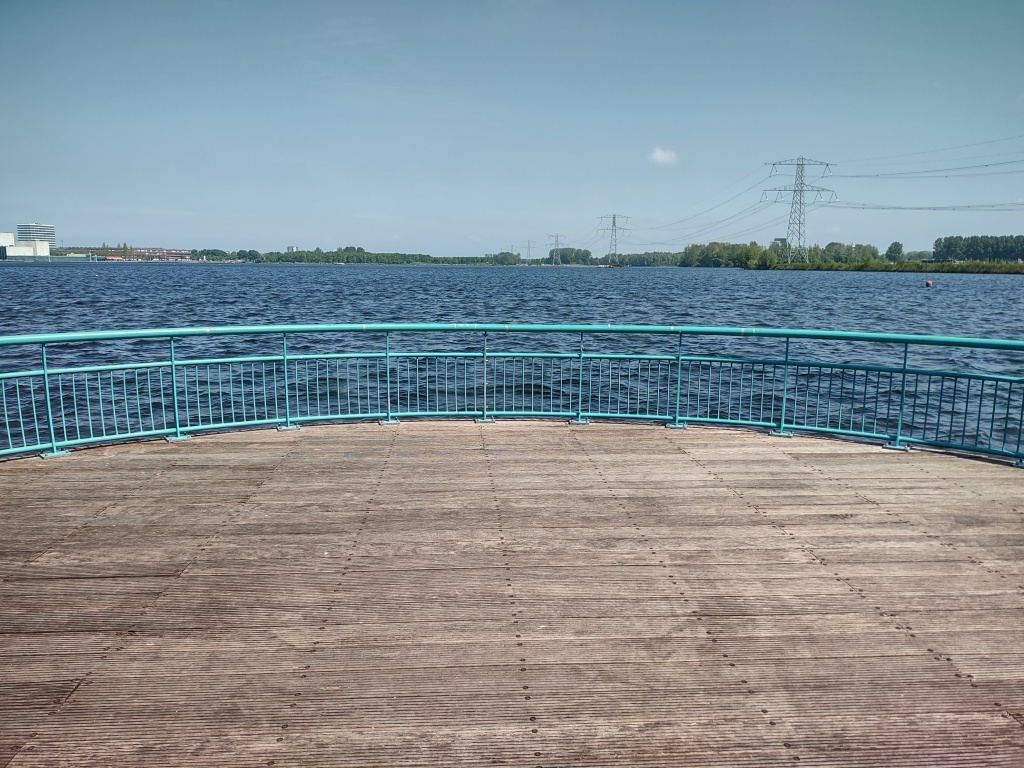
The Maastrichtkwartier has a funny area with a jetty, together shaped – more or less – as a boat.
Because the location is close to where I live, I was able to walk down to this spot, do some sampling and return to home again. Earlier I noticed that the pH of the samples will vary with the (micro-) location. Even samples taken just one metre apart (some in a sunny place, others more in the shadow) will differ in their pH value. That’s why I took three different samples this time, only about a couple of metres apart. The samples were measured immediately after bringing them up and discarded afterwards, except for the third one. The third one was measured again 46-64 hours later, to check whether the pH changed a lot.
I have to admit that I sampled around midnight and early in the morning again, but I was not enough of a fanatic to get up in the middle of the night as well. At least I was not willing to do so for now, not having seen any effects yet.
Again the buffers were measured before and after the experiment and the accuracy is ok, with the precision being within a couple of hundreds.
Averages of three samples for every moment during the day, with an 99% Confidentiality Interval
Because I measured three samples, I was able to determine the standard deviation and calculate a 99% Confidence Interval (green lines). The whole Y-axis only covers 1 full pH point, so it is clear that the chance of the water actually being neutral is negligible. At the same time the differences between evening or midnight and sunny conditions during the day are also very small. It is interesting that for some moments the standard deviation was larger than for others. A very small part of it is the caused by the pH meter, but the location seems to be more influential.
In the end, the high pH found in several lakes can’t be the result of plants taking away CO2. There is a small effect, probably causing the pH to change with tens of a point, but certainly not bringing the pH up a whole point from neutrality (from 7 to 8 or more)!
In scientific terms our hypotheses would have been:
H0 photosynthesis does not change the pH from neutrality to a value around 8 (night values won’t be neutral, that is).
H1 photosynthesis is responsible for the high pH found in the lakes (and during the night the pH will drop to neutral or even acid values).
Not being able to reject the H0 is not proof that H1 is false, but in this case the variations are so small that H1 is nowhere in reach! In the past I plead for a “confirmation interval” in addition to the “rejection interval” (outside of the 95% or 99% confidentiality interval), to avoid wrong conclusions and here things are rather clear. There might be a very small photosynthetic effect, but it’s not enough to explain a pH of 8 or even higher. We could even say that the pH did not change significantly during the day and we have to look for another explanation.
46-64 hours later (depending on the age of the sample) I measured all third samples again and put them in a graph. The original values of the third samples (not the averages of the three shown in the graph above, because only sample 3 was kept!) are shown as a grey reference-line. Unlike previous series, the pH drop was rather small, but the temperature was also 10 oC lower. If biological activity is causing the drop, then it makes sense that the change was much smaller now, because of the lower temperature.
The same scale was used in both graphs, so it’s easier to compare the fluctuations during the day and the shift after two or three days.
Of course Almere is only a part of the Netherlands. Going on a trip to the North I selected some other sample points, which I would visit during my trip. The Ijsselmeer was sampled at two points: Lelystad and Lemmer. It’s separated from the Markermeer, so I wondered if the pH would be very different. Then in Frisia the Tjeukemeer was sampled at the parking “De Lanen” (actually under the A6). Traffic was not as good as expected and I had to ignore the other sample points planned for, but for now it will do.
Let’s see what the results were. It would be a rather long day and the measurement of the samples at home would be ten hours later. For the other lakes we already noticed that the pH drops a little bit during the days after, so I decided to take my pH meter with me and do the first measurement right after sampling.
By now it won’t be a surprise that the IJsselmeer is also was in the higher pH range, but the same applied to the Tjeukemeer! Back at home I measured the samples again and two days after another time (of course measurements were done in duplo, taking all precautions). The results are shown below.
The calibration was not an issue anymore. The buffers provided very stable values during the last week or so. I don’t put in the graph, because it might be boring. Of course all the data are available in a spreadsheet and I keep my original log papers.
Having collected enough samples to know that al least not all surface water in the Netherlands is acidic, I went looking for explanations. Ammonia seemed to be a possibility, but it’s not very likely, because the water quality is sufficient. Moving to soil samples in the future, it will be interesting to determine the inorganic Nitrogen (NO2–, NO3– and NH4+) and I read a lot about all kinds of methods (hoping to find a less complex and less dangerous method than the classic Berthelot in dozens of scholarly articles). Limestone, concrete and all kinds of waste water could explain local elevations of the pH, but not in several different lakes at the same time.
The I found an interesting site saying “An additional cause of elevated pH is high photosynthetic activity, which removes carbon dioxide from water and raises pH”. This would mean that the pH differs throughout the day. Biological activity is also a good explanation for the pH-drop of the samples, because I keep them in the dark, but not cool.
The next investigation might be (very) local again, now looking at the factor time!
After the surprise of the Weerwater being rather alkaline, I set up a map of new sample points for different lakes. Biking together with my eldest son, it took 50 km and a couple of hours to collect them all, but let me show you the map before we go on.
The Weerwater was in again, but only with two sample points now. It was clear that the pH was not very different at the sample locations last time, so it made sense to reduce the number of sample locations. The other large lake (Noorderplassen) got two sample locations as well. The water around Almere is formally divided in three lakes with different names, but all these are remainders of the former sea (Zuiderzee), which became a sweet-water lake after closing the dam (Afsluitdijk) 90 years ago. The Markermeer and IJmeer are not separated by any construction, but got different names. The Gooimeer, to the South is connected to the IJmeer, but the connection is rather narrow.
Now the question is, will these lakes be more acidic or at least less alkaline than the Weerwater?
The same (clean) sample bottles were used and rinsed with the lake-water first before collecting the actual sample. Because of the long trip, the measurement was done a couple of hours after sampling, but again we will check what happens to the pH during the days after sampling. The weather remained nice. About 25 oC and still no rain!
The results were completely different from what I expected – again. More alkaline samples and this time even more extreme! The Markermeer scored 8.92, but I still had this issue with the pH meter being slightly off. That’s why I applied a correction formula and presented the corrected values. For the Markermeer the corrected value became 8.69. Still a very high pH. Although I had some trouble getting my pH meter right (fortunately the next time everything became stable), this value is confirmed by an article (although a couple of years old). It says that the pH of the Markermeer is around 8.7.
The good news about the measurements is that the days after I finally managed to get my pH meter stable (rather accurate and precise, using the calibration buffers). After this new attempt the measurements could vary a couple of hundreds, but the average was stable and close to the buffer’s value. I calibrated once and then the values remained stable. The 4.00 buffer was checked less frequently because the samples were in the region above 7.
Seeing the stable results, I was confident to measure the change of the pH of the samples over time again. Like the previous set the samples were kept in a closed bottle, at room temperature and in the dark. During a couple of days after sampling they were measured and stored again.
For most samples the pH will drop slowly, meaning the sample is getting less alkaline. Most likely this is the result of some biological processes. Either the alkaline factor is processed, or some acid is formed (neutralising the sample) or both. Since I don’t have chemical details (yet), we can only guess. By the way: all data are available in a spreadsheet and the original logs will be kept. Please reach out at anrep3d@gmail.com if you are interested.
In the previous post the conclusion was that the water of our lake (Weerwater) is definitely alkaline. But will the pH change during the days after sampling? A little bit of air was available in the bottle, but it remained sealed, meaning no additional oxygen was present. Measuring during the days after was not planned, but turned out to be a good exercise. I had to know the pH meter and its behaviour, so I measured again the next day, the day after and so on. It turned out that the pH moves towards neutral, but very slowly. Most likely this is the result of biological processes, performed by micro-organisms, like bacteria. Either the alkaline factor is being removed, or neutralising acid is being produced – or both. I don’t see a relationship with the amount of organic matter at the sample location. Especially the “Fantasie beach” (actually I sampled at the end of a jetty) was rather clear, but it is the area where a lot of water skiing is going on!
The first couple of times I was calibrating before the measurement and checked the pH of the buffers afterwards. When I realised there is a small deviation rather soon (minutes), which doesn’t change in the days after I didn’t calibrate the next time, but checked whether the values for the buffers were unchanged. They were.
Next time I will tell about the water samples taken from different lakes in Almere. The old hypothesis of slightly acidic water was revitalised. I expected the “Weerwater” to be anomaly
One has to start somewhere and since we live very close to a lake that’s what I preferred.
This lake is the central lake of Almere, called “Weerwater”, meaning “Water again”. It actually describes the history of the lake, because at first the former Zuyderzee (litterally Southern Sea) was closed off by a dam and eventually became a sweet water lake. Then about half of it was drained and became new land (polder) and on this land the town of Almere was built. To get enough sand for the construction works, a huge pit was dug to serve as a sand quarry. After completion of the construction works the pit gradually filled itself with water and was left as a lake, so it was water again after the draining. Now this hole in the sea bottom is the lake “Weerwater”. The bottom of the – rather shallow – lake is covered with water plants and those have to be mown now and then to allow the boats to cross the lake without destroying their propellers. It is about three times the size of the reservoir in Central Park New York.
Of course a sample at a single location would not do, so I selected several points around the lake to take my samples and went on a ride with my bike. Currently the tour is about 12 km. May 7, 2022 was a nice warm day with a temperature of about 25 oC
Sample points lake “Weerwater” Almere, with GPS coordinates
After collecting the samples, I started the pH measurements. Of course I had a hypothesis and it was that areas with more decaying organic material would be slightly more acidic than others. Because of the CO2 in the air I expected the water to be slightly acidic anyway, although not the 5.75 measured in my demineralised water after being shaking for a couple of seconds.
You already know I bought this nice pH meter and had to learn to work with it. At first I calibrated it with the three buffer fluids meant for this purpose, but it seemed like the meter had a “drift” (systematic error), because afterwards the buffer values seemed to be different (after every calibration). Measuring during a couple of days I noticed that the drift only applied to the values shortly after calibration. Then the deviation remains stable, at least for several days. The electrode was rinsed thoroughly after every measurement, especially when buffers where involved because they are capable of changing the pH of non-buffered fluids strongly.
Bottles used to store water samples
The bottles were plastic ones (150 ml), originally holding fruit shots, but thoroughly cleansed with hot and cold tap water and detergent rinsed several times with tap water and demineralised water, which after a while always seems to have a pH below 6 (slightly acidic). As a young boy, over fifty years ago now, I noticed that an inspector taking samples to determine milk quality at a farm, wrote with a pencil on an opaque area on the glass. Now I made a similar opaque area at the bottle’s surface using sand paper. No labels needed!
During sampling at the lake, the bottles were rinsed with lake water once, before taking the sample. Then the bottle was closed and kept at room temperature. The first series of measurements were done only a couple of hours after the collection of the first sample, but additional measurements were performed the days after. The additional hypothesis was that samples with more (microscopic – the fluids were all clear) organic material would tend to get a lower pH (more acidic).
To make a long story short: my original hypotheses about acidity went out of the window. The water was rather alkaline! I’m sure about that, because in between I measured demineralised water and after the measurements I determined the pH of the buffers again (showing more or less the same systematic error again and again). Although the pH meter is sold with a precision of 0.01, I think we have to accept an error of about 0.2 for the accuracy, which is all right. Especially in the alkaline area there is a slight tendency to exaggerate the alkalinity, meaning the measured pH is about 0.2 higher than what it should be according to the calibration buffer. Below the averages of the first three measurements (performed an hour after taking the last sample) are shown (the names identify the location – Dutch names).
Boat Maastrichtkwartier.
8,16
Harbour Stedenwijk.
8,02
Pier near Schipperplein
8,30
Lumièrepark beginning
8,27
Weerwaterbridge
8,26
Fellinibridge
8,30
(point inaccessible)
Fantasie beach
8,29
Average pH of three measurements for all Weerwater samples
Below there is an explanation about the systematic error, but the conclusion is that we should take off 0.2 from the measured values to have a more reliable outcome. However, the water will remain alkaline anyway! The values around the lake differ slightly, but in general they are around 8!
Now the question is: how did the water get a pH above 7 (alkaline) instead of the expected value below 7 (acidic)? My new hypothesis was that this could be the result of the construction of the Floriade – the large world exposition for horticulture – or other constructions with concrete going on. That would mean other lakes in Almere would have a lower pH. I will tell you about those measurements another time, after explaining what happened with the pH during the days after collection.
For those who want more detail about the precision and accuracy of the measurements: Learning to know the new pH meter, I calibrated several times and noted down what the measured values of the buffers were after a while. It looked like there was a bit of a drift, but measuring after several days without calibrating, it turns out it’s a rather stable systematic error. To show this systematic error of the buffer measurements, I present the average and standard deviation below. Although there is a 95% confidentiality interval, the deviation from the buffer’s real value is much more interesting. I’ll spare you the details, but we have to correct the measured values by 0.2 towards neutral, reducing the alkalinity. The buffer 4 value is not very stable, but that’s because the focus is not at this range, making it less reliable. The electrode also needs some time to switch several pH points and during the first measurements and I probably didn’t wait long enough in the acidic region. After all the pH meter is very precise and stable, but not completely accurate at the moment. It may be better to wait some time before pressing the calibration button. Still learning!
Buffer 6.86
Buffer 4.00
Buffer 9.18
Measured (average)
6,75
4,08
9,36
“Error”
-0,11
0.08
0.18
Standard dev.
0,08
0,39
0,21
Lower 95% Conf.Int.
6,60
3,29
8,95
Upper 95% Conf.Int.
6,91
4,86
9,77
Precise values, but not completely accurate as there is a systematic error
Before and after my graduation I had written a book and done some freelance work, but it was not enough to make a living. So I decided to take a regular job, but nobody was looking for a biochemist! That’s why I started my additional education in business administration/finance and I was able to get a job at the large hospital, where I already did the research for my Master’s degree. This time it was about answering business questions and creating reports for the board, with the help of datasets and one of the first personal computers. Gradually I was drawn into the world of business data and processes. Eventually I became a consultant specialised in business process management and (financial) reporting.
The original Scientassist logo!
Yet I wanted to do something more creative, more entrepreneurial. That’s why I founded my company Scientassist, about thirty-three years ago. Despite the description (“bureau for scientific assistance”), I was selling my first product: a map in which areas were coloured automatically, based on an input-file and a set of boundaries. Other products followed, but that’s all water under the bridge. Those adventures can still be read at my old blogs for VRBI and AnRep3D (and even EnRep3D).
Now the question is what this Scientassist blog will be about. Let me explain. Throughout Europe we have a serious problem with Nitrogen deposits and acidification of our soil and water. We know a large part of it is related to our current agricultural practices. We need farmers, but we should help them to change their business models. I was asking myself how I could contribute, going back to my roots. It all starts with providing some insight in the concentrations of Nitrogen-compounds in soil, water and air.
Using IoT (Internet of Things) to set up a network of measurement points would be nice. I thought by now we would have cheap but accurate sensors to measure NH3 of NH4+ and NOx, but I was mistaken. Setting up a small chemical lab, like I had in my youth and even after my graduation (actually until I became a father, around the time Scientassist was founded), would not be the best choice either.
Finally I discovered that pretty good pH meters, with a glass electrode, are very affordable now! Since the indirect effect of the Nitrogen-deposits is acidification, I could work with water and soil samples, to create a pH-map of the Netherlands as a first step.
This isn’t sponsored content!
Next time I will tell about what happened from this moment on. Despite my education as a scientist, this blog should be considered as “citizen science” rather than formal scientific research, backed by a university.